
Explore and analyze your cataract and refractive surgery results with
Refractive Surgery Graphics
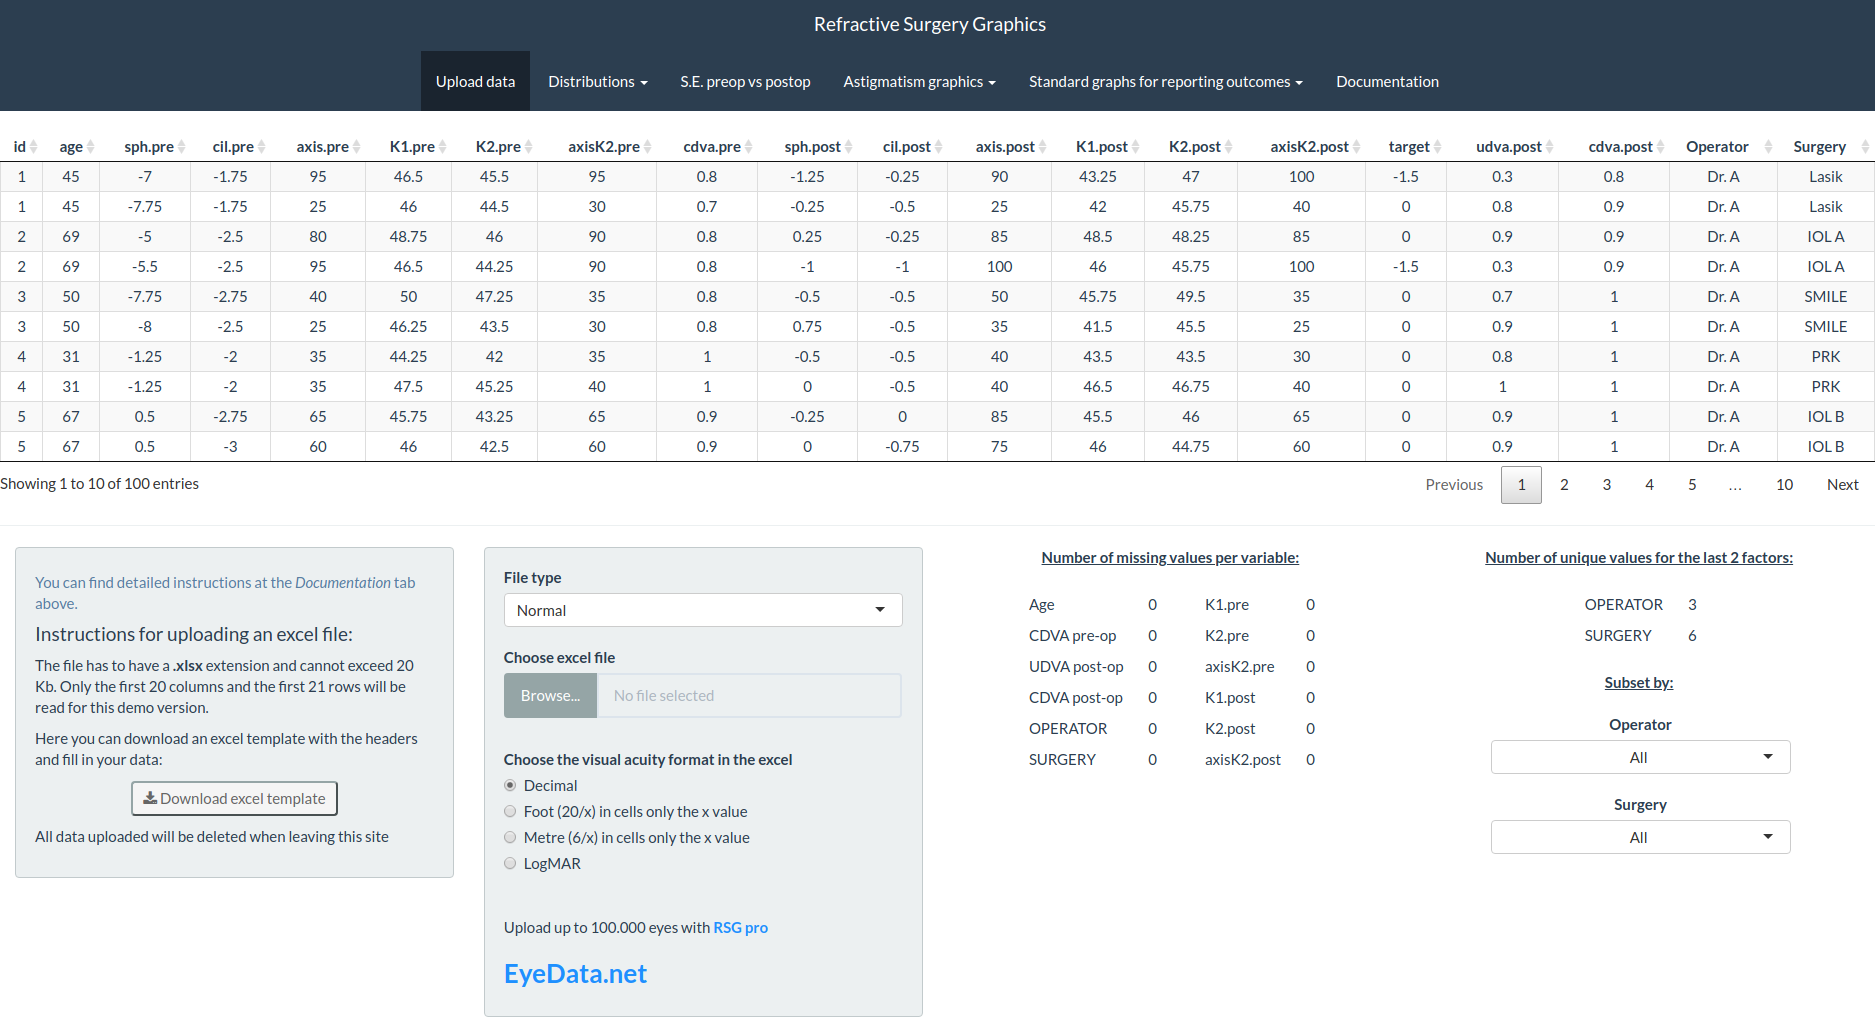
RSG features:
- Upload an excel file with up to 100.000 rows and 20 columns, an excel template with just the headers is available to download
- 18 flexible standard columns, just fill in the data you have, leave the rest blank. Age, visus, refraction and keratometry pre-op and post-op and target refraction
- 2 factors of your choice to fill in
- Data summary and validation
- In eligible graphics, choose the points you want and download them as an excel
- Descriptive graphics
- Refractive or corneal SIA
- Standard graphics to report refractive surgery outcomes
- Download a report in pdf with the standard graphics and coefficients. Choose a title and an introduction for it
Analyze your strabism surgery outcomes with
S T R A B A L Y Z E
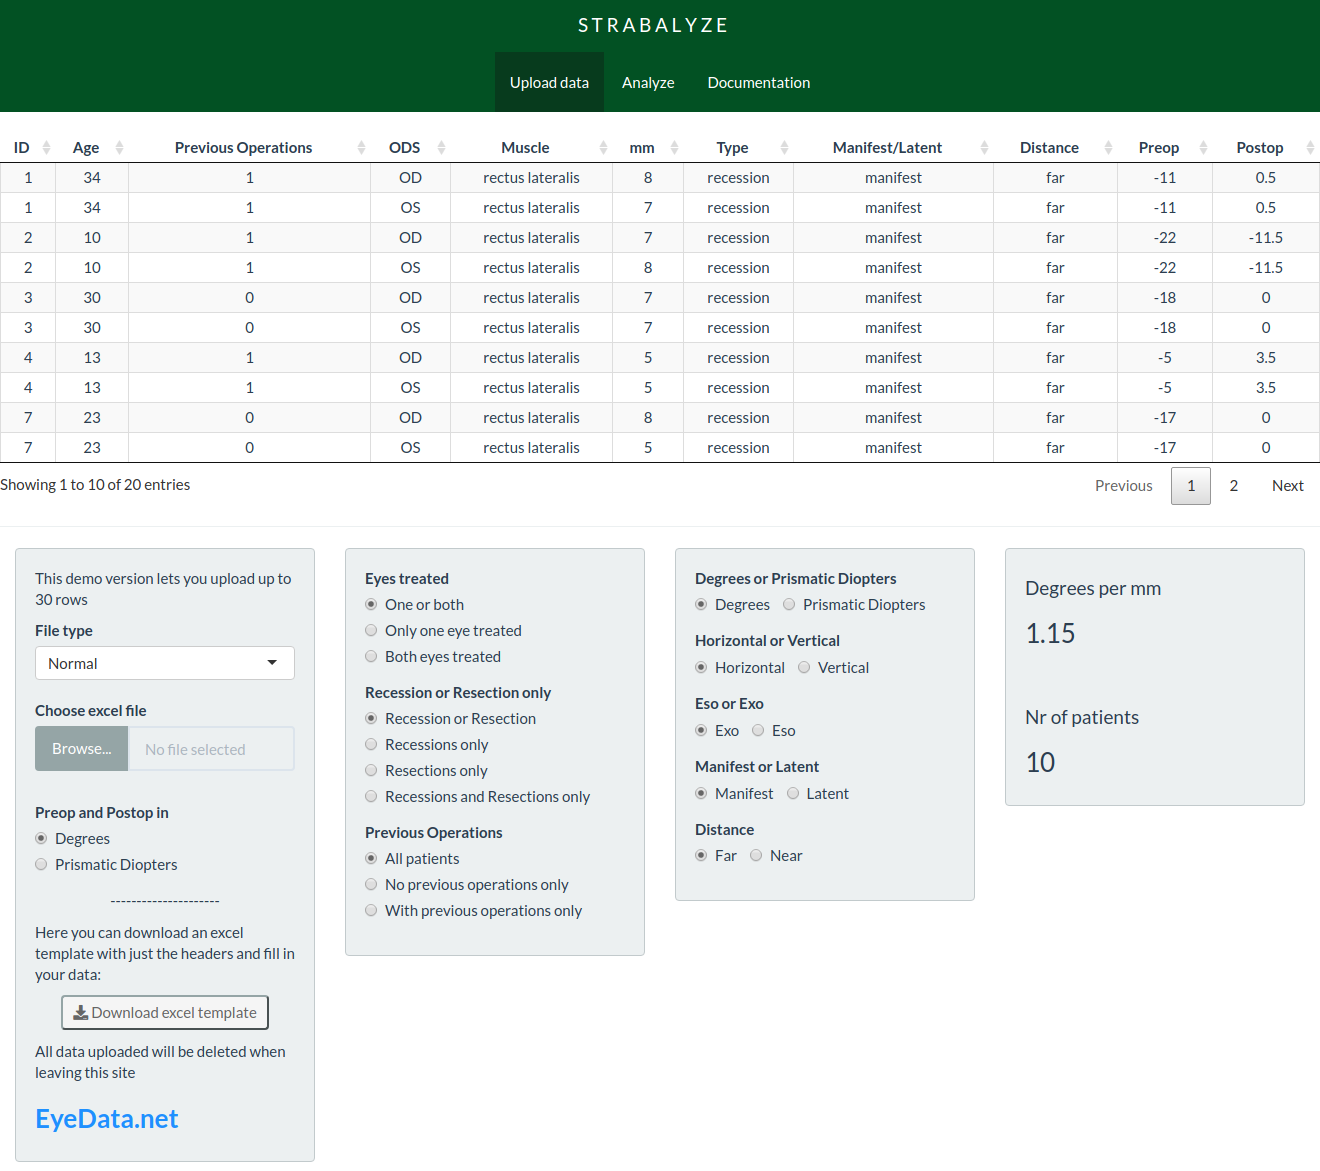
Strabalyze features:
- Strabalyze calculates the degrees or PD per milimeter of recession and/or resection
- Upload an excel file with up to 50.000 rows and 11 columns, an excel template with just the headers is available to download
- Data validation
- Columns: ID, Age, Previous Operations, ODS, Muscle, mm, resection or recession, manifest or latent, far or near, pre-op and post-op deviation
- Upload data in degrees or prismatic diopters and convert results between them
- Lots of filters
Prism calculator
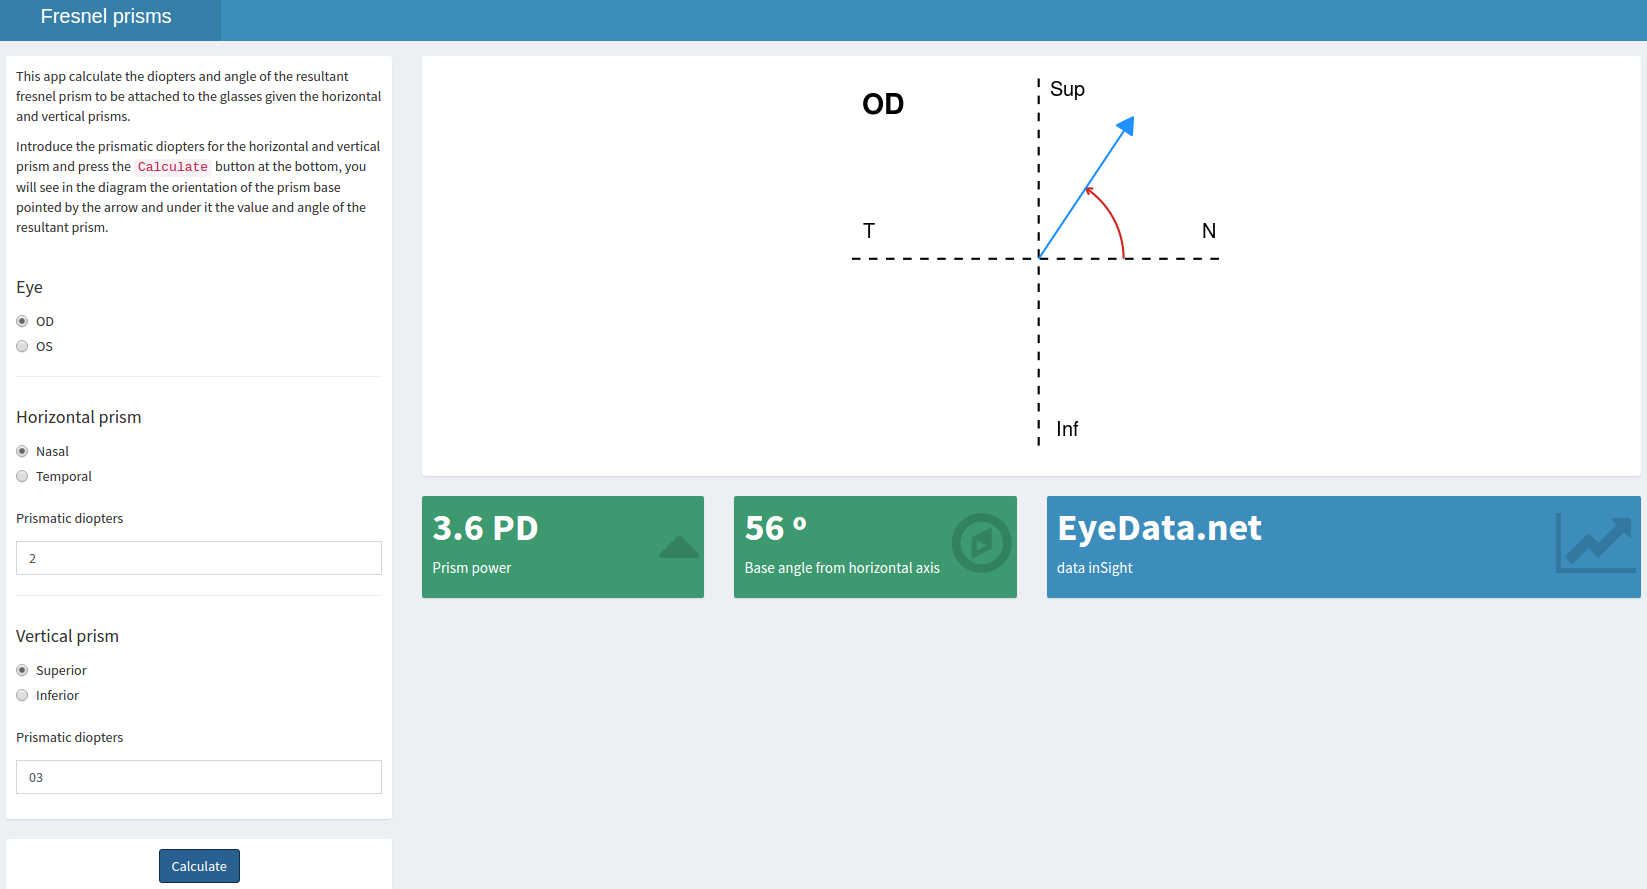
Calculate the magnitude and angle resultant of two prisms. Useful to know the orientation and magnitude of a fresnel prism in glasses.
Optotype calculator
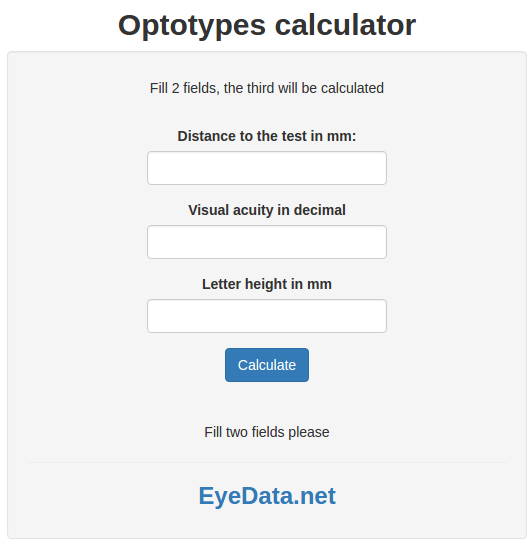
Calibrate your optotypes or see what is the visual acuity if you change the intended distance of the test.
Single case SIA calculator
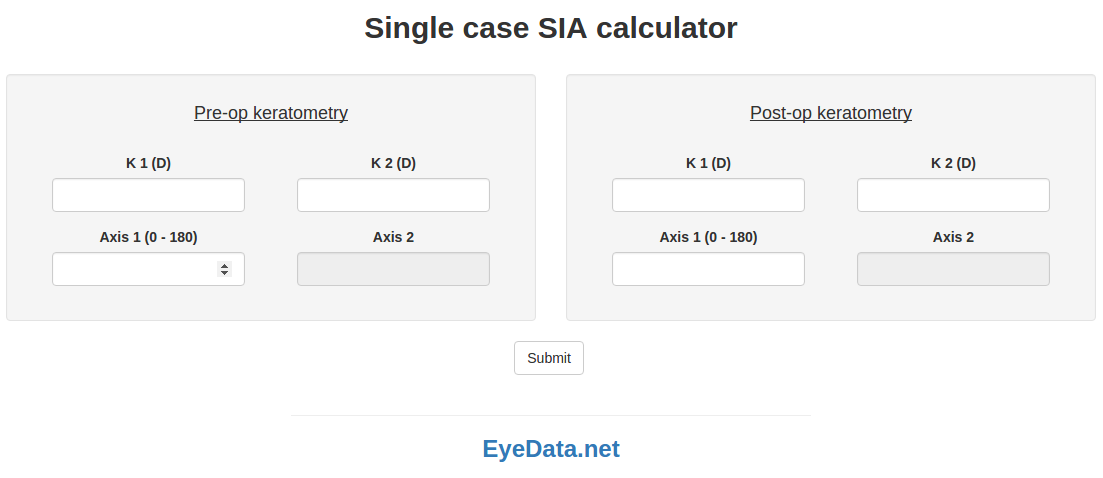
Fill in pre-op and post-op keratometry and get the corneal SIA.
Glaucoma guide
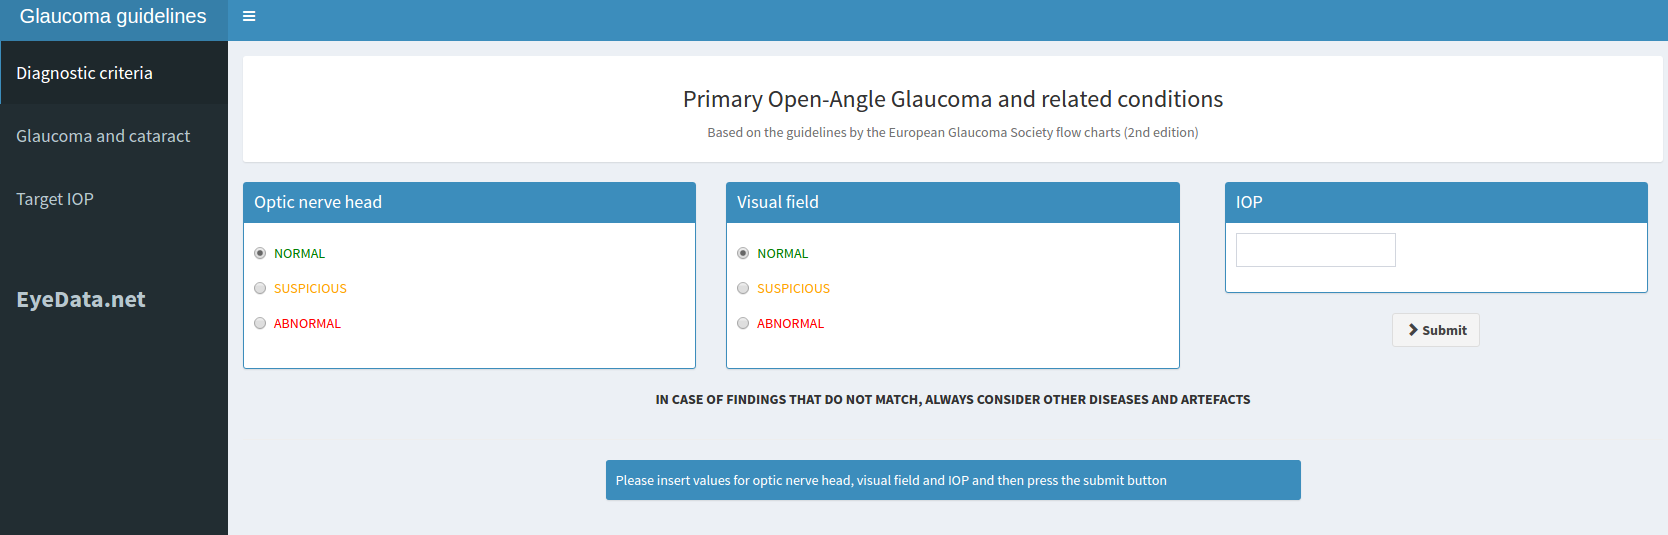
Based on the flow charts of the European Glaucoma Society 2nd edition.
Welcome to EyeData